Every request that reaches a website leaves a line in the web server’s access log: who made it, when, to which address, with what result. When a WordPress site is compromised, somewhere in those files is the request through which the attack got in. Finding it is the most reliable way to know which hole to close, instead of just deleting the symptoms.
In a previous article we described how we use local artificial intelligence models to sort through the requests that no rule recognizes. Here we take a step back to the manual part: what a log line looks like on Apache, NGINX and LiteSpeed, where to find it, what traps time zones and rotation hide, and a few recipes with grep and awk for the most common cases.
What a log line looks like
The three web servers most commonly used with WordPress use, barring special configurations, the same basic format: the so-called combined log format, born with Apache and adopted as the default by NGINX and LiteSpeed too. A typical line looks like this:
203.0.113.45 - - [27/Aug/2026:22:41:07 +0200] "POST /wp-admin/admin-ajax.php HTTP/1.1" 200 312 "https://www.esempio.it/contatti/" "Mozilla/5.0 (Windows NT 10.0; Win64; x64)"From the left: the client’s IP address, two identity fields (almost always empty, shown as a dash), date and time with the time zone, the request line with method, path and protocol, the response code, the bytes sent, the referer and the user agent. In Apache this corresponds to the directive LogFormat "%h %l %u %t \"%r\" %>s %b \"%{Referer}i\" \"%{User-agent}i\"" combined; in NGINX to the default combined format, built with the variables $remote_addr, $time_local, $request, $status and so on.
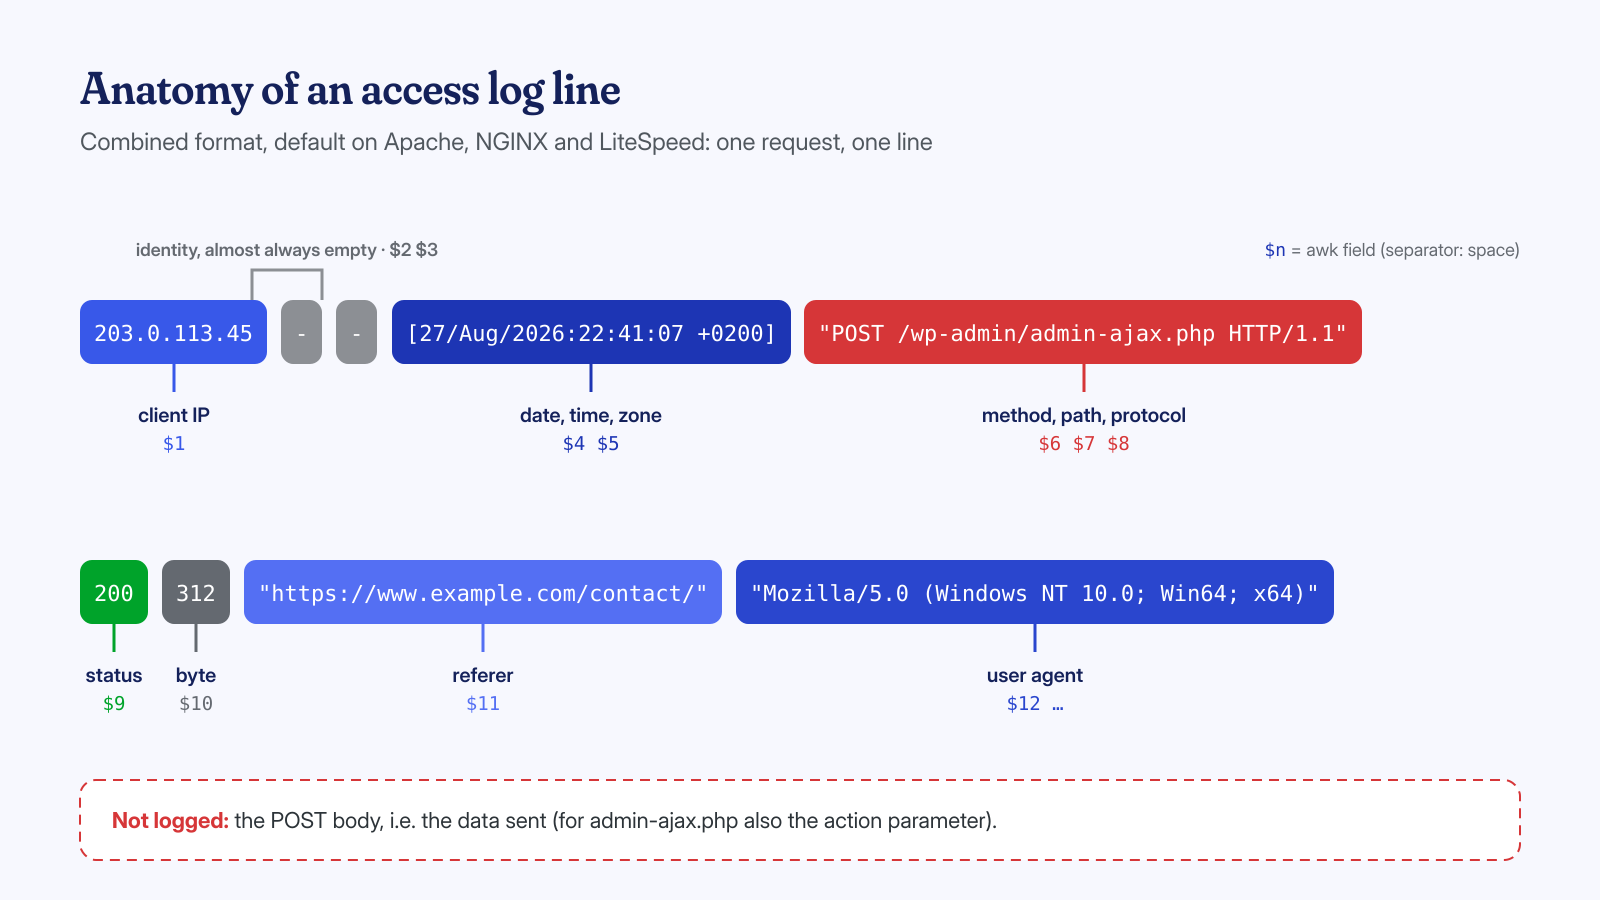
Two things are missing. The first is the body of POST requests: you can see that someone sent data to admin-ajax.php, but not which data. The second is the site name, if several domains share the same file. That is why, on the servers we manage, we extend the format with a few fields useful for analysis, knowing that every extra field shifts the numbering used in scripts:
# NGINX: ISO 8601 date, response time, host and original IP behind a proxy
log_format forense '$remote_addr - $remote_user [$time_iso8601] "$request" '
                   '$status $body_bytes_sent "$http_referer" "$http_user_agent" '
                   '$request_time $host "$http_x_forwarded_for"';
access_log /var/log/nginx/access.log forense;

# Apache: same concepts (%D is the response time in microseconds, %v the virtual host)
LogFormat "%a %l %u %{%Y-%m-%dT%H:%M:%S%z}t \"%r\" %>s %O \"%{Referer}i\" \"%{User-Agent}i\" %D %v" forense
CustomLog ${APACHE_LOG_DIR}/access.log forense
In LiteSpeed the format is set from the admin panel, at the server level or for each virtual host, with a syntax derived from Apache’s. On cPanel installations, where LiteSpeed reads Apache’s configuration, the Apache directives apply.
Where to find the logs
The location depends on the web server, the distribution and, above all, any hosting panel. The most common default paths are:
- Apache:
/var/log/apache2/on Debian and Ubuntu,/var/log/httpd/on RHEL, AlmaLinux and Rocky Linux, often with one file per virtual host; - NGINX:
/var/log/nginx/, with separate files if theaccess_logdirective is defined in individualserverblocks; - LiteSpeed and OpenLiteSpeed:
/usr/local/lsws/logs/for the server, and for virtual hosts the folder given in their configuration, oftenlogs/inside the virtual host root; - cPanel:
/usr/local/apache/domlogs/, one file per domain and one with the-ssl_logsuffix for HTTPS traffic; users see the compressed archives in~/logs/, if archiving is enabled; - Plesk:
/var/www/vhosts/system/<dominio>/logs/, withaccess_log,access_ssl_logand, if NGINX acts as a proxy in front of Apache, theproxy_access_logandproxy_access_ssl_logfiles as well.
On shared hosting without command-line access, logs are usually downloaded from the panel, in sections with names like “Raw Access”, “Logs” or “Statistics”. If the panel shows only aggregated statistics, ask the provider’s support for the raw files, specifying the period you are interested in: many keep them longer than they make available to the customer, but not forever, so the request should be made right away.
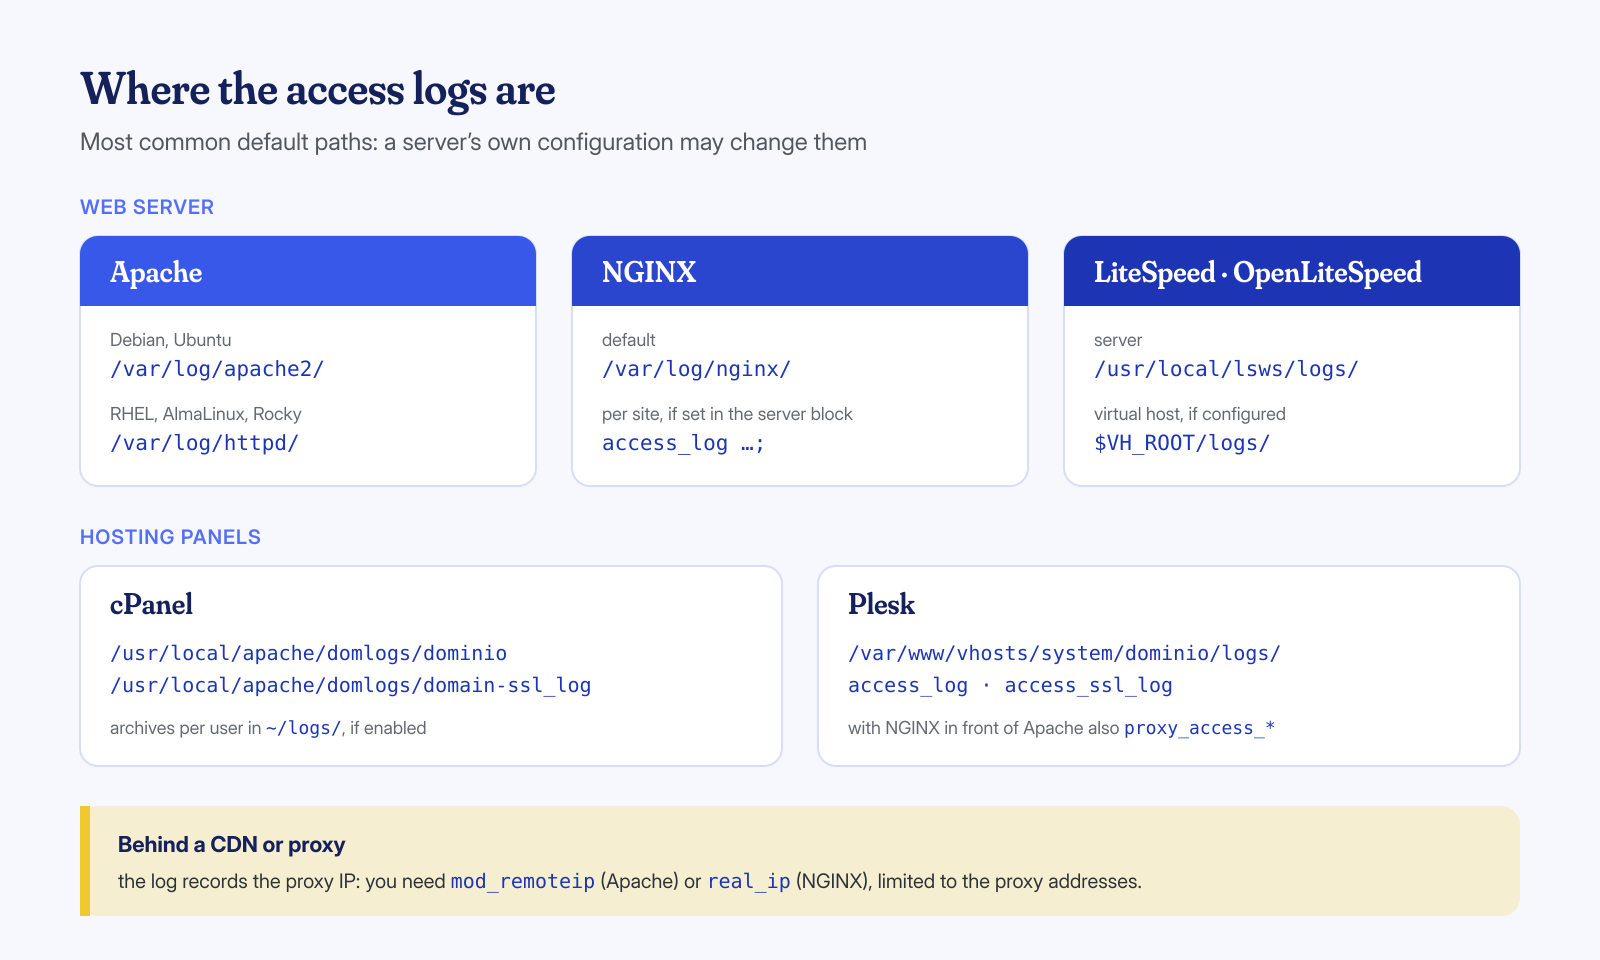
An important warning concerns sites behind a CDN or reverse proxy, such as Cloudflare. In that case the web server sees the proxy as the client, and without specific configuration it always logs the same few CDN addresses: analysis by IP becomes useless. The real address arrives in a header, such as X-Forwarded-For or CF-Connecting-IP, which you need to make the web server use with Apache’s mod_remoteip module or NGINX’s real_ip, trusting only headers coming from the proxy’s addresses. Otherwise, anyone could insert a fake address.
Time zones and rotation: the two traps
The date field reports the server’s local time with its offset from universal time: +0200 in Italy in summer, +0100 in winter. The problem arises when you cross-reference different sources. A proxy or CDN log may be in UTC, WordPress stores some dates in the time zone set on the site and others in UTC, and the find command shows file dates in the session’s time zone. A one-hour offset is enough to look for the attack in the wrong window. Before correlating, bring everything to the same time zone, for example by prefixing commands with TZ=UTC.
The second trap is rotation. Almost all systems use logrotate, which renames the file every day or every week, compresses it and deletes the oldest after a certain number of cycles. The access.log file therefore contains only the last few hours or days; the rest is in access.log.1, access.log.2.gz and so on, for as long as it exists. On many shared hosts retention is only a few days: if the infection was discovered after a month, the logs from the time of the attack may be gone.
# How far back the available logs go
ls -ltr /var/log/nginx/
zcat -f $(ls -tr /var/log/nginx/access.log*) | head -1

# Search all files, compressed or not, in chronological order
zcat -f $(ls -tr /var/log/nginx/access.log*) | grep '"POST /wp-login.php'

# Configured retention
grep -A8 '/var/log/nginx' /etc/logrotate.d/nginx
From files to logs: correlating dates
The most solid starting point is almost always a malicious file you have already identified. Its modification date can be forged with a simple touch, while the ctime, the moment of the inode’s last status change, is updated by the system and cannot be set at will without elevated privileges. So you start from the list of PHP files with a recent ctime:
# PHP files with a status change after August 1, in chronological order
TZ=Europe/Rome find /var/www/esempio.it/public_html -name '*.php' \
  -newerct '2026-08-01' -printf '%C+ %T+ %p\n' | sort

# 2026-08-27+22:41:13.4817260440 2023-11-02+10:14:55.0000000000 ./wp-content/plugins/form-x/tmp/sess.php
#   ^ ctime: real write             ^ mtime: forged
With the time in hand, you look at two windows in the log. Before the write: which request, a few seconds or minutes earlier, could have created the file? Usually a POST to a vulnerable component, an upload, an admin login. After the write: who requested the new file directly, and from which address? Those requests confirm the use of the backdoor and give you the addresses to search for in the rest of the logs.
# All requests between 22:36 and 22:41 on August 27
grep -E '27/Aug/2026:22:(3[6-9]|4[01]):' access.log

# Who used the new file, and when
zgrep -h 'form-x/tmp/sess.php' access.log* | awk '{print $1, $4, $6, $9}'

# Everything those addresses did, from the start of the available logs
zcat -f $(ls -tr access.log*) | grep -E '^(203\.0\.113\.45|198\.51\.100\.7) '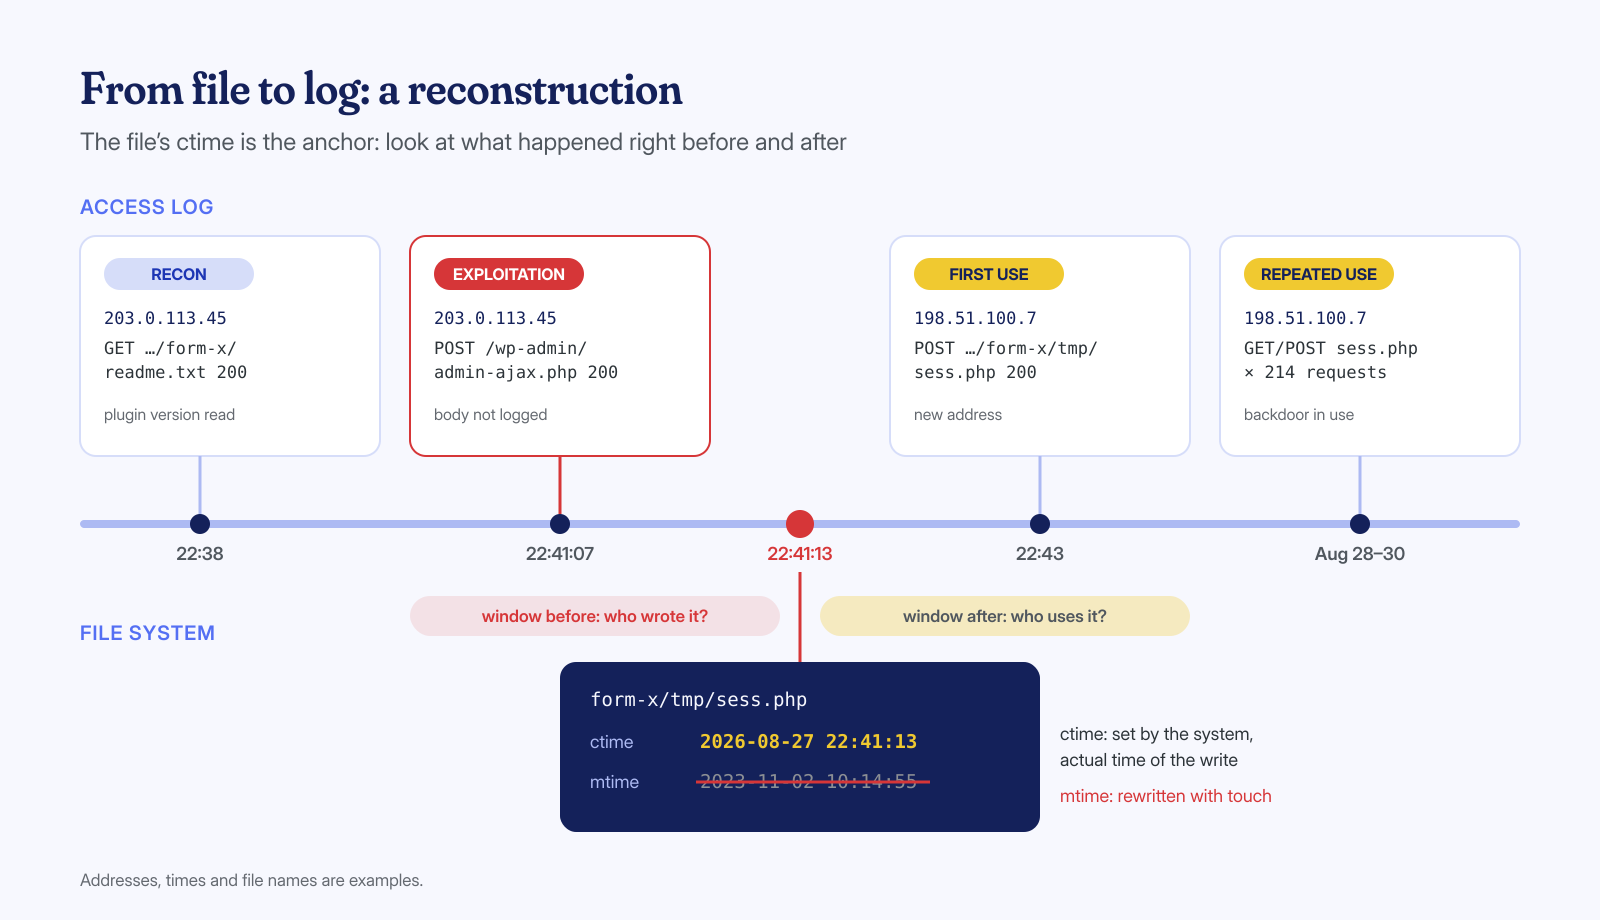
Once you’ve found the entry point, it’s worth separating noise from targeted attack. Every exposed site constantly receives automated requests to paths that don’t exist, such as backup copies of wp-config.php, .env files or panels of other software, and most end with a 404. These are scanners that try everything on everyone; they matter little, unless one of those requests received a 200. Targeted requests, by contrast, hit paths that really exist on the site, meaning installed components, and get consistent responses.
# Most requested paths with a 404: the background noise
awk '$9 == 404 {split($7, p, "?"); print p[1]}' access.log | sort | uniq -c | sort -rn | head -20

# The same "scanner" paths, but with a 200: these need a look
grep -E '"GET /[^ ]*(wp-config\.php\.(bak|old|save)|\.env|\.git/config)[^ ]* HTTP/[0-9.]+" 200 ' access.log
Brute force on wp-login.php and xmlrpc.php
Password-guessing attempts are the background noise of any WordPress site, and almost always fail. The point is not to count them, but to work out whether one succeeded. A detail of WordPress behavior helps here: a POST to wp-login.php with wrong credentials returns the login page again with a 200 code, while a successful login responds with a 302 redirect to the dashboard.
# Login attempts per address
grep '"POST /wp-login.php' access.log | awk '{print $1}' | sort | uniq -c | sort -rn | head

# Logins with a 302: likely successful logins, to verify one by one
awk '$6 == "\"POST" && $7 == "/wp-login.php" && $9 == 302 {print $1, $4}' access.log

# xmlrpc.php: requests per address
awk '$7 ~ /^\/xmlrpc\.php/ {print $1}' access.log | sort | uniq -c | sort -rn | head
A 302 is not proof: security or custom login plugins can redirect too. But a 302 from an address that until a minute earlier was collecting 200s is a strong signal, to be compared with the site’s sessions and users. For xmlrpc.php there is one more caution: with the system.multicall method a single request can contain hundreds of login attempts, and the log shows only one line. Counting lines underestimates the attack; it helps to look at response size as well, which grows with the number of attempts included.
admin-ajax.php and the REST API
Many plugin vulnerabilities go through two common entry points: wp-admin/admin-ajax.php, where the action parameter decides which plugin function runs, and the REST API routes under /wp-json/, also reachable in the ?rest_route= form. REST routes appear in full in the log; for admin-ajax.php, on the other hand, action is visible only if sent in the query string, because in POSTs it sits in the body.
# admin-ajax.php actions visible in the query string
grep -oE 'admin-ajax\.php\?[^" ]*action=[^&" ]+' access.log | sed 's/.*action=//' | sort | uniq -c | sort -rn

# Most requested REST routes, in both forms
grep -oE '"(GET|POST) /(wp-json/[^ ?"]+|[^ "]*\?rest_route=[^ &"]+)' access.log | sort | uniq -c | sort -rn | head -20

# User enumeration
grep -E 'wp-json/wp/v2/users|[?&]author=[0-9]+' access.log
What you’re looking for is the anomaly compared with the site’s normal traffic: a plugin route that no visitor uses, called from a single address a few seconds before a file appeared; a sequence of POSTs to admin-ajax.php with no page visited beforehand, which a real browser doesn’t do; an action whose name matches a recently published vulnerability for an installed plugin. Once the vulnerable component is identified, the fix is to update or remove it; while waiting for the patch, the route can be blocked at the web server or application firewall level.
User agents and addresses: what they tell you and what they don’t
The user agent is chosen by whoever makes the request, so it should be read as a claim, not a fact. It is useful in reverse: careless automated tools give themselves away with values like python-requests, Go-http-client, curl or an empty string, and an attack run with the same script often keeps the same user agent even when changing addresses, which lets you link requests coming from different IPs.
# Most frequent user agents among POST requests
awk -F'"' '$2 ~ /^POST / {print $6}' access.log | sort | uniq -c | sort -rn | head -20

# Does a request claiming to be Googlebot really come from Google?
host 66.249.66.1                          # must resolve to *.googlebot.com or *.google.com
host crawl-66-249-66-1.googlebot.com      # and the name must resolve back to the same address
The IP address also says less than it seems. Attacks come from rented servers, compromised residential networks, proxies and VPNs, and the same operator can change address with every request. It serves to group requests and to temporarily block whoever persists, not to identify who is behind them. Reverse DNS verification, however, is the method Google recommends for recognizing its own crawlers, and it is valuable for working out whether malware shows different content to Googlebot, typical of SEO spam with cloaking.
A method, and its limits
Lined up, the recipes become a method: set the time anchors from the file system, bring everything to the same time zone, look at the windows before and after each anchor, collect the addresses and user agents involved, trace their activity backwards to the first suspicious request. The result is a sequence you can explain line by line, and it is what lets you say with reasonable certainty where the attack got in.
The limits must be taken into account. Without the body of POST requests many hypotheses remain hypotheses; if the logs have been rotated away, the attack window may be lost; if the attack came through SFTP, the hosting panel or another site on the same account, there is nothing to find in the web server log. That is why the analysis always cross-references multiple sources: error logs, PHP-FPM logs, SSH and FTP access, scheduled tasks and the database.
Every cleanup we do ends with the most likely attack vector and the measures to close it, reconstructed exactly this way, with the help of locally run models for the most repetitive part. Restoring a WordPress installation is guaranteed within 6, 12 or 24 hours depending on urgency. If you have the logs and want to understand what happened to your site, get in touch: the first thing we’ll ask you is not to delete them.
